The health of our skin can be impacted by a number of environmental and lifestyle factors, from the natural world to our jobs and diet, skin health, and can highlight and have an effect on our overall health.
To help reveal the skin health of the US, we’ve analyzed which of the continental US states have are the best for healthy skin.
Which is the best state for healthy skin?
Analyzing all of the states in the continental US, we’ve scored each based on several factors, including: average UV exposure, water quality, average hours of sleep, diet, and even income level. All of which have been shown to impact and affect how healthy your skin might be.
The best states for skin health
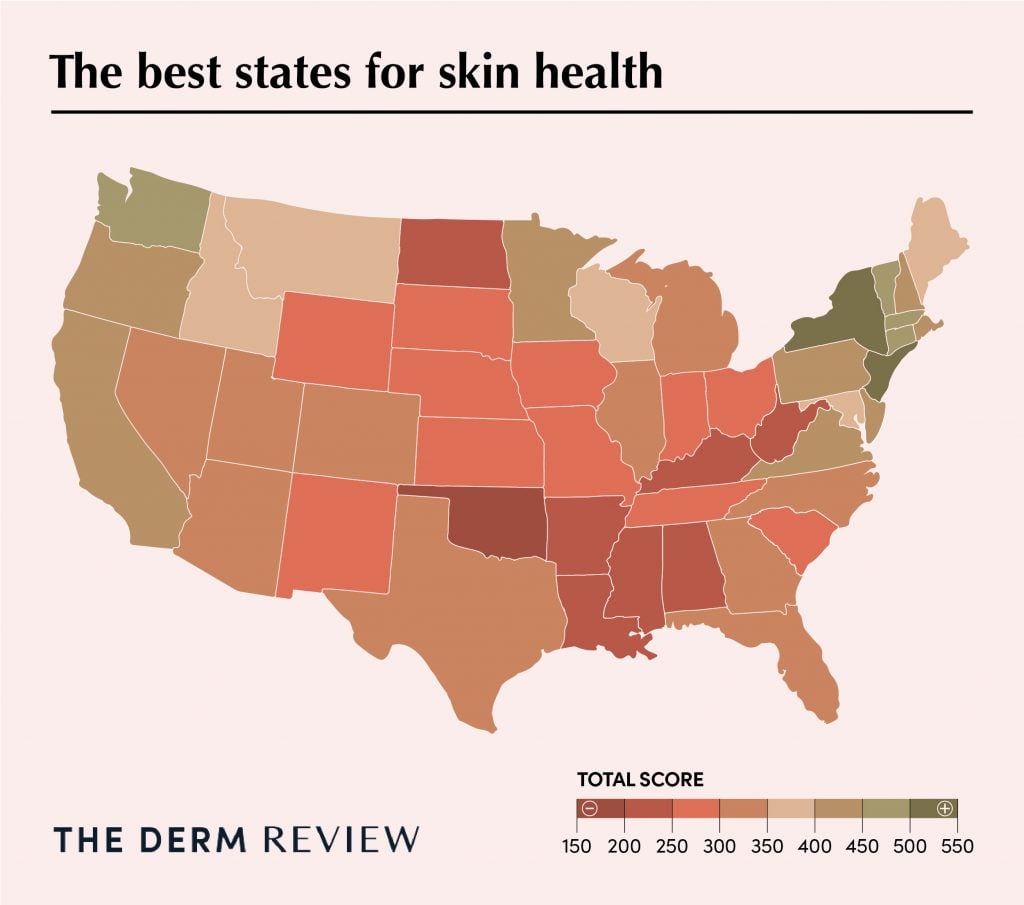
Our analysis of the 48 continental US states revealed that New Jersey has the best environment and lifestyles for healthy skin, with 525 points out of 672 (78.1%). Specifically, New Jersey scored well in the areas of diet, sleep, and obesity.
The state of New Jersey is closely followed by New York, which scored 502 points; 74.7% of the 672 available. New York scored highly in the areas of UV exposure and diet.
Rounding off the top five (5) states for skin health are Connecticut (498), Massachusetts (490), and Washington (470).
At the other end of the scale, Oklahoma was found to have the worst environments and lifestyles for skin health, scoring just 182 points (27.1% of those available), scoring poorly in the areas of diet, obesity, and active lifestyles.
Just above Oklahoma, Mississippi (213), Arkansas (216), Louisiana (232), and Alabama (237) make up the remaining bottom five (5) states for healthy skin.
UV exposures impact on healthy skin
One of the key environmental factors to skin health is UV exposure, with UVA and UVB common causes of skin cancers, aging, sunburn, and a range of other impacts on skin health.
Analyzing data from the National Cancer Institute (NCI), we were able to see which states experience the most UV exposure annually, and which in which states people should be applying SPF frequently.
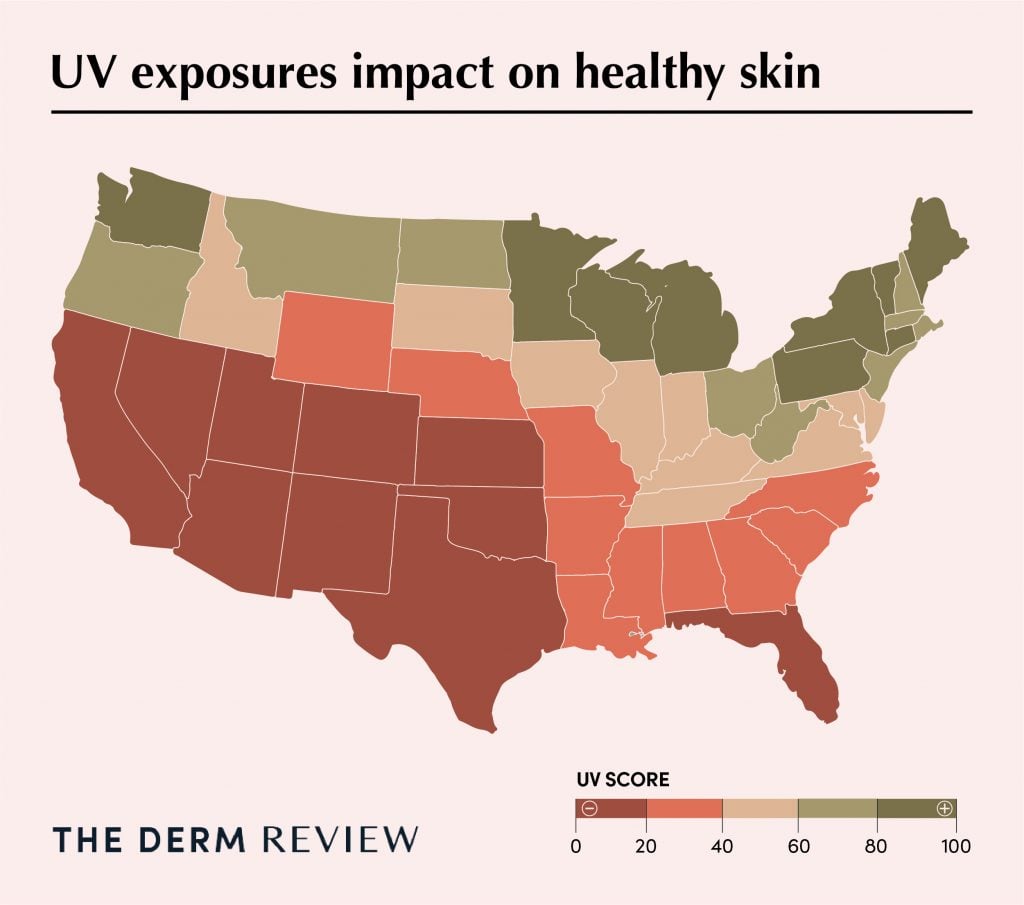
As the map shows, those living in Washington state are exposed to the least amount of harmful UV rays, experiencing 3594.08 Wh/m². Conversely, those living in Arizona are exposed to the most (5528.55 Wh/m²).
As you can see the further north, and ‘greener’ the environments, the less exposed you are to UV radiation.
Water hardness’ impact on skin health
Water hardness can be linked to many skin problems, not least acne, and eczema.
Hard water can also have an impact on your finances, causing you to pay for new soaps, moisturizers, and other skincare products more frequently. This is due to the chemical reactions between soap and the minerals in hard water leading to films of ‘soap scum’ blocking pores and stripping the skin’s natural moisture.
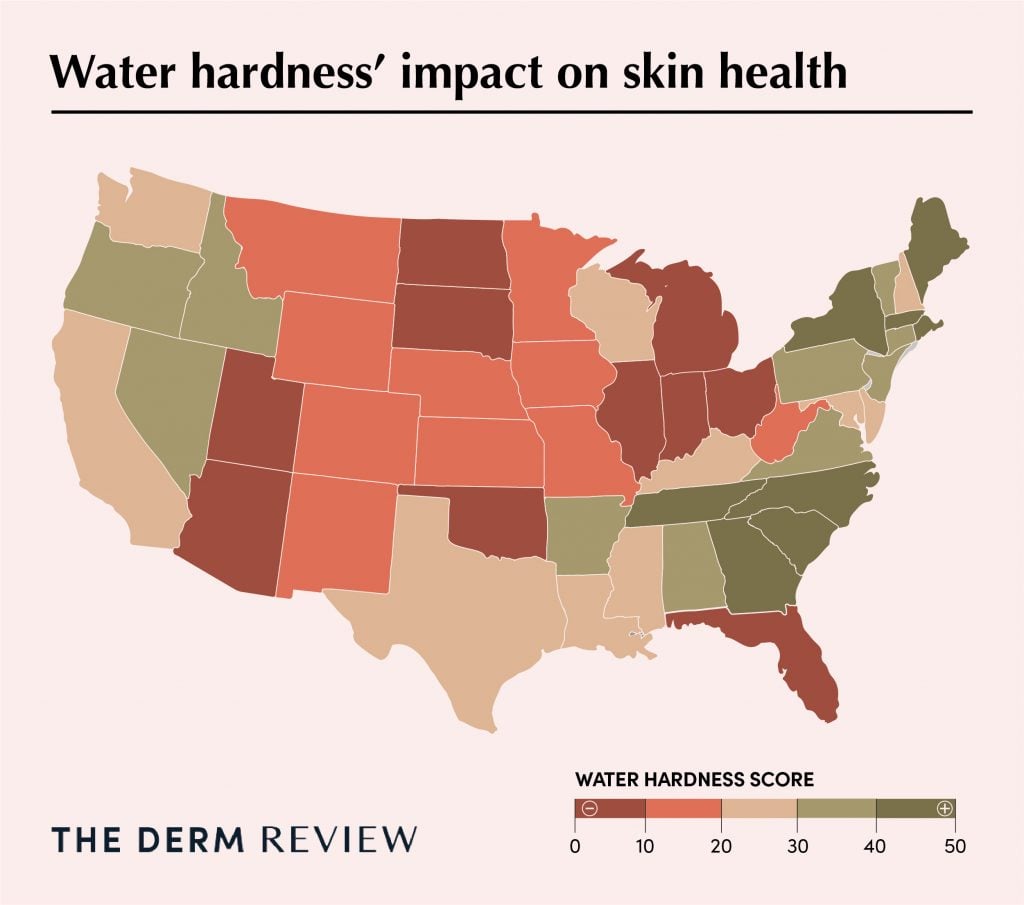
Those living in South Dakota experience the hardest water in the continental US, with a median hard water reading of 593 mg/l CaCO3. The high level of water hardness indicates that people in South Dakota are likely to experience drier skin, abnormally frequent replacement of soaps and other products, and increased acne breakouts.
In comparison, Maine was found to have the softest water, with a median 4.20 mg/l CaCO3 reading in the state.
Air quality’s impact on skin health
Pollution in the air is linked to a variety of diseases and other conditions, however, research has also shown that poor air quality can impact skin health.
Poor air quality and high levels of pollution in the air have been linked to skin aging, inflammatory or allergic skin conditions (such as dermatitis, eczema, psoriasis), acne, and even skin cancer.
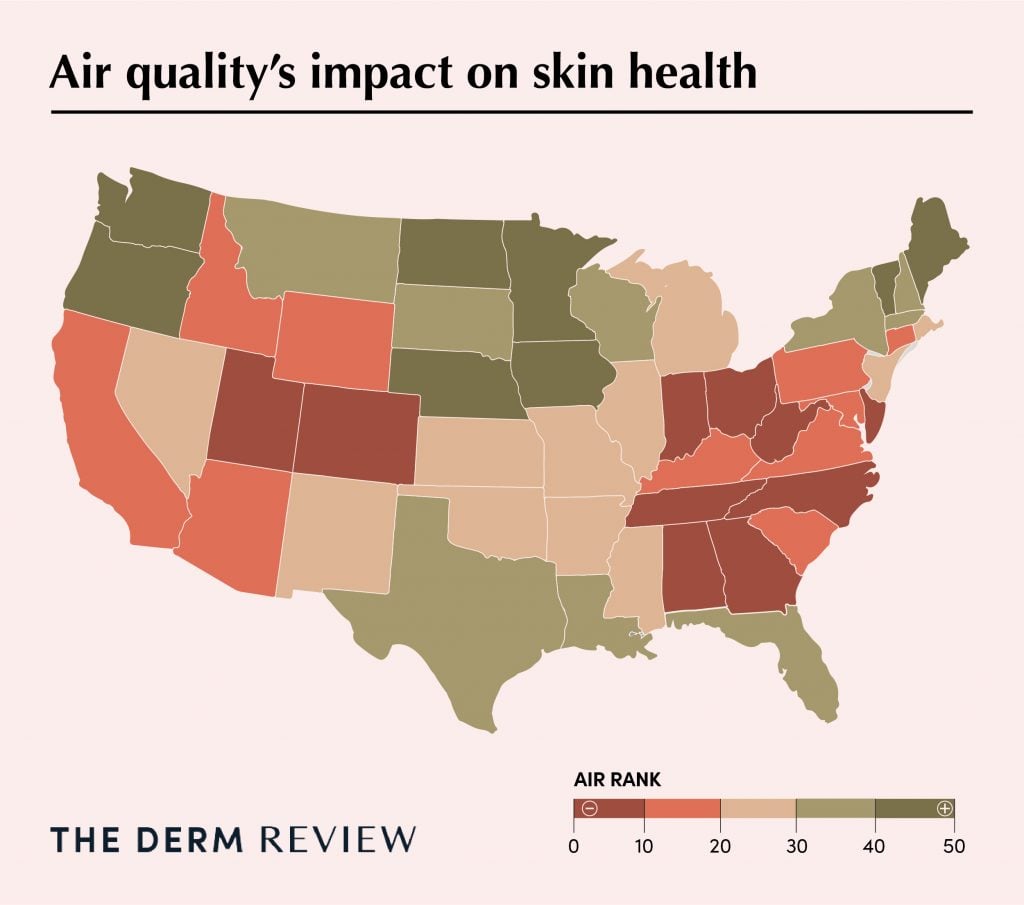
Our analysis found Washington state has the best air quality, of the continental US states, with an average air quality score of 33.5. Nearby Oregon ranks as the second-best state for air quality, with an air quality score of 36.1, closely followed by Maine (36.5).
The worst state for skin health due to air quality is Utah, with an average air quality score of 51.2.
The average score of 51+ breaches the “good” air quality banding, putting Utah in the “moderate” banding, meaning that while the air quality is acceptable, it can pose a risk to those who are sensitive to air pollution.
Average temperature effects on skin health
Temperature can have multiple impacts on the skin, too hot and the increased sweat can lead to breakouts of acne and heat rashes, too cold and the reduced humidity can lead to skin ‘cracking’ and flare-ups of “dry skin” conditions such as eczema.
In light of the impacts of the colder, dryer, air impacting the skin and leading to an increase in various conditions that can take a longer time to clear, we’ve ranked the states by their average annual temperatures, with ‘warmer’ states being the best.
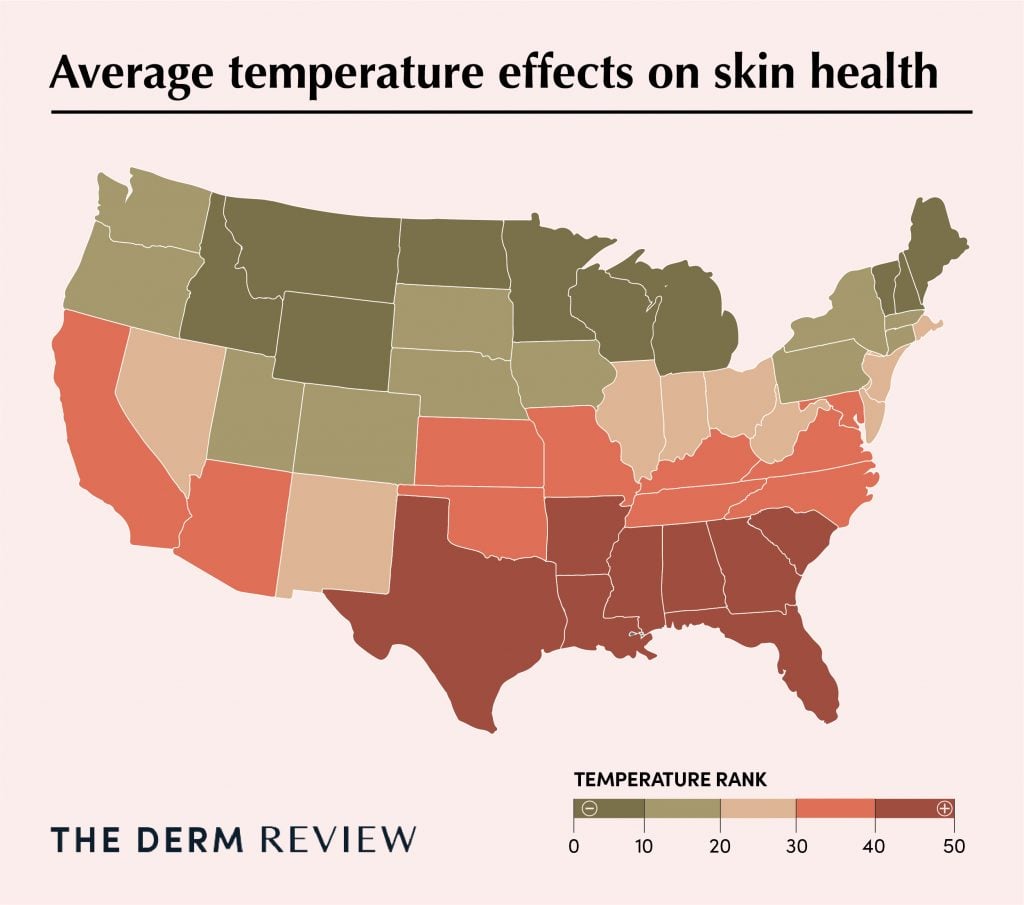
Naturally, the warmer areas are in the southern states, with the best state temperatures being Florida, with an average temperature of 70.7°F (21.5°C). The second warmest state being Louisiana, with an average temperature of 66.4°F (19.1°C).
The coldest state, and worst for skin health, is North Dakota. The average annual temperature in North Dakota is 40.4°F (4.7°C), closely followed by Maine, 41°F (5°C).
Humidity impact on skin health
Relative humidity can have a number of effects. If the environment is too humid you’ll sweat excessively, see acne breakouts, experience heat rash, or even suffer from anhidrosis. Too low humidity and you can suffer or see a flare-up in dry skin conditions, or even heightened skin allergies.
To analyze this, we’ve ranked each state based on how close their average humidity levels are from the sweet spot of between 30% to 60% RH (Relative Humidity), using 45% as the key figure.
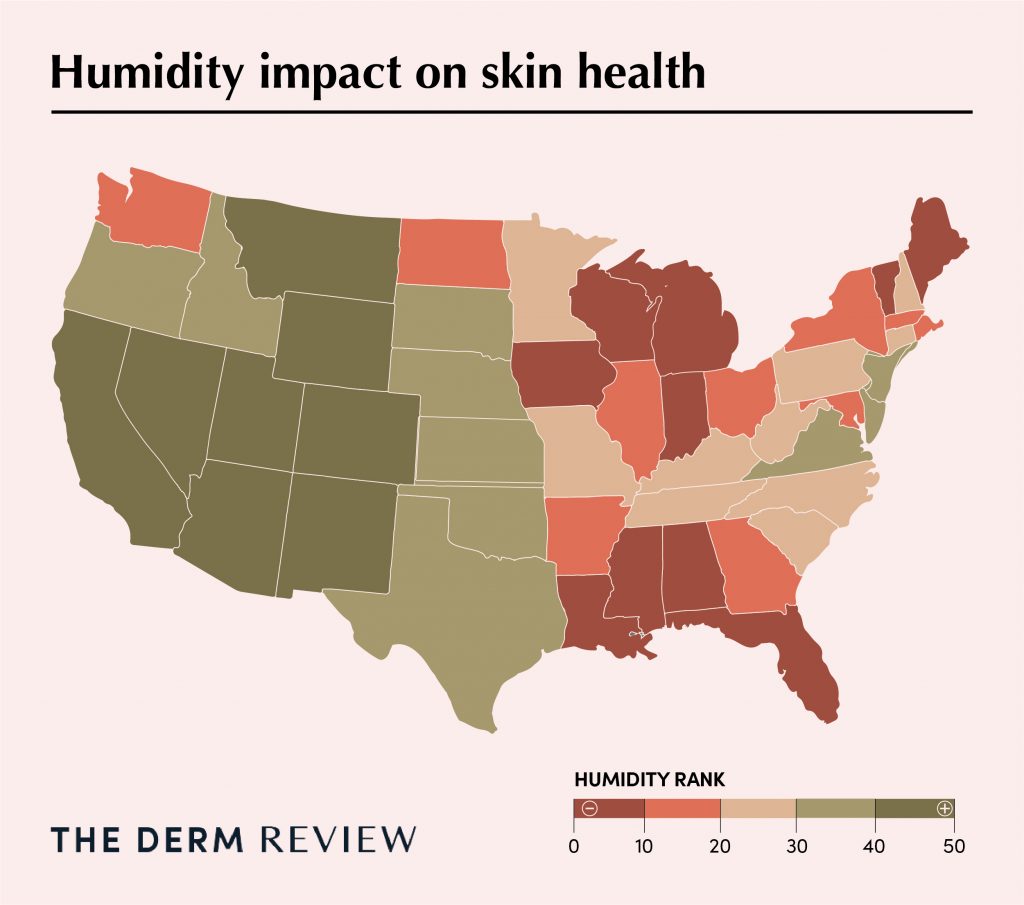
Our analysis found that New Mexico has the best average Relative Humidity (RH) for skin health, in the continental US. New Mexico averages a RH score of 45.9%, just 0.9% away from mid-point (45%) of the 30-60% RH best range for skin.
In comparison, Florida, with an average RH of 74.5%, has a humidity score that is 29.5% above the 45% “sweet spot”. With a RH 29% above the 45% “sweet pot, Louisiana is the second-worst state for humidity and skin health.
Sleeping and skin health
The benefits of sleeping enough are well known, but one that often gets overlooked is the impact on skin health. Yes, beauty sleep is a real thing.
Getting 7 or more hours of sleep a night has been shown to reduce the onset and number of wrinkles, improve skin complexion, brighten and reduce puffiness around eyes, improve hair health, help you appear happier (and healthier), and improve the efficacy of skin products.
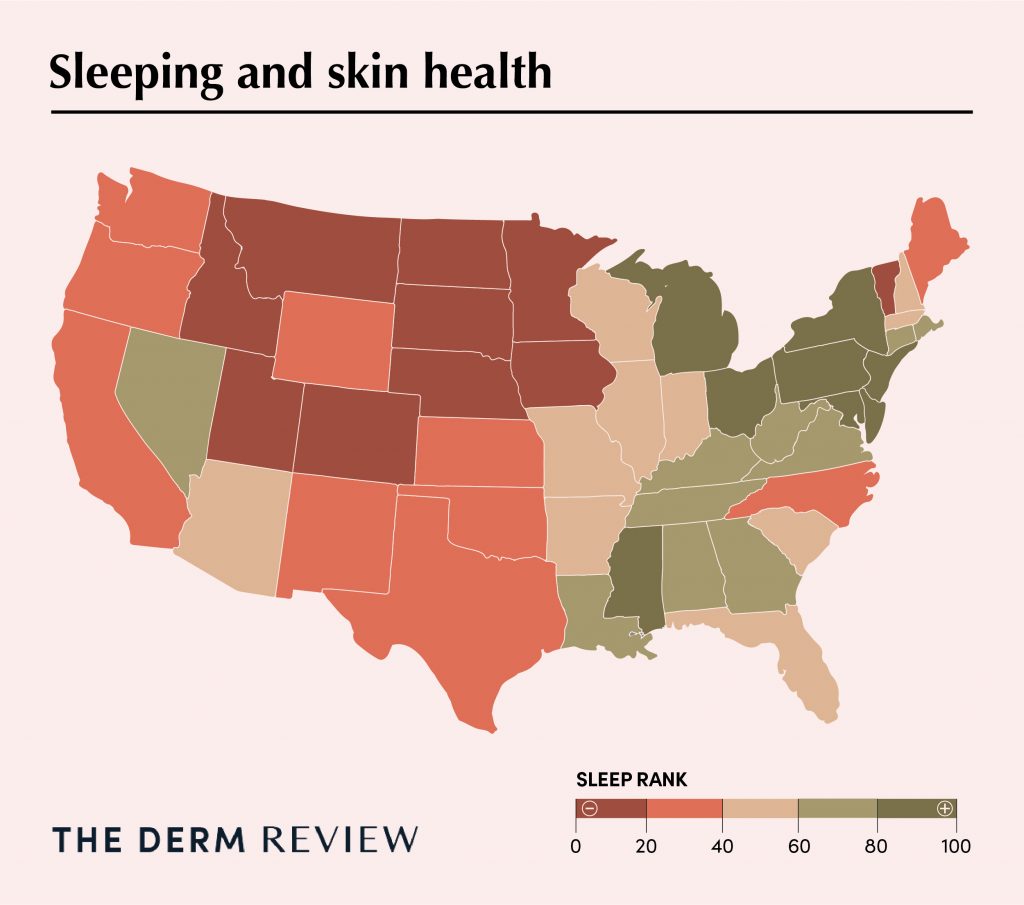
Our research found that 45.5% of people in the state of New Jersey sleep for 7 or more hours, the highest of any continental US state. The second best state for skin health through sleep is Maryland, with 43.5% of its population getting more than 7 hours of sleep per night.
South Dakota (27%) and North Dakota (27.5%) were found to have the lowest percentage of people getting enough sleep for good skin health.
Diet and skin health
Healthy eating and a good intake of fruit and vegetables are great ways of improving your regular health, as well as your skin health.
Eating fresh fruit and vegetables, as part of a healthy diet, has been shown to fight wrinkles, improve complexion, and reduce and heal blemishes.
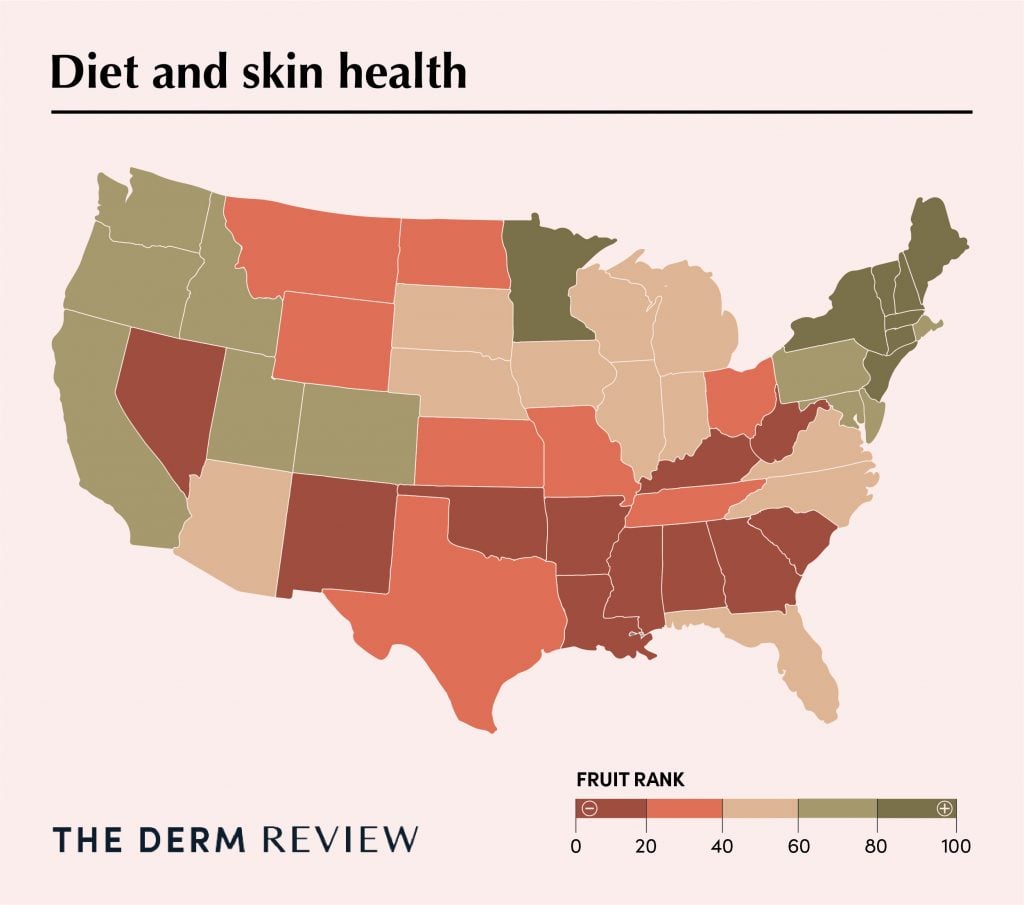
Analyzing data on the percentage of each state’s population that consumes fruit less than once a day, revealed that nearly half (48.4%) of people in Oklahoma don’t consume fruit daily, closely followed by those in Mississippi (47.5%).
People living in Vermont are the most likely to eat at least one piece of fruit per day, with just 32% of the population consuming fruit less than once per day.
Activity and healthy skin
Regular physical activity can help to deliver oxygen and nutrients to the skin, keeping the skin healthy, promoting collagen production, and helping to boost new skin cells, each of which helps to improve complexion, “glow”, and fight skin aging.
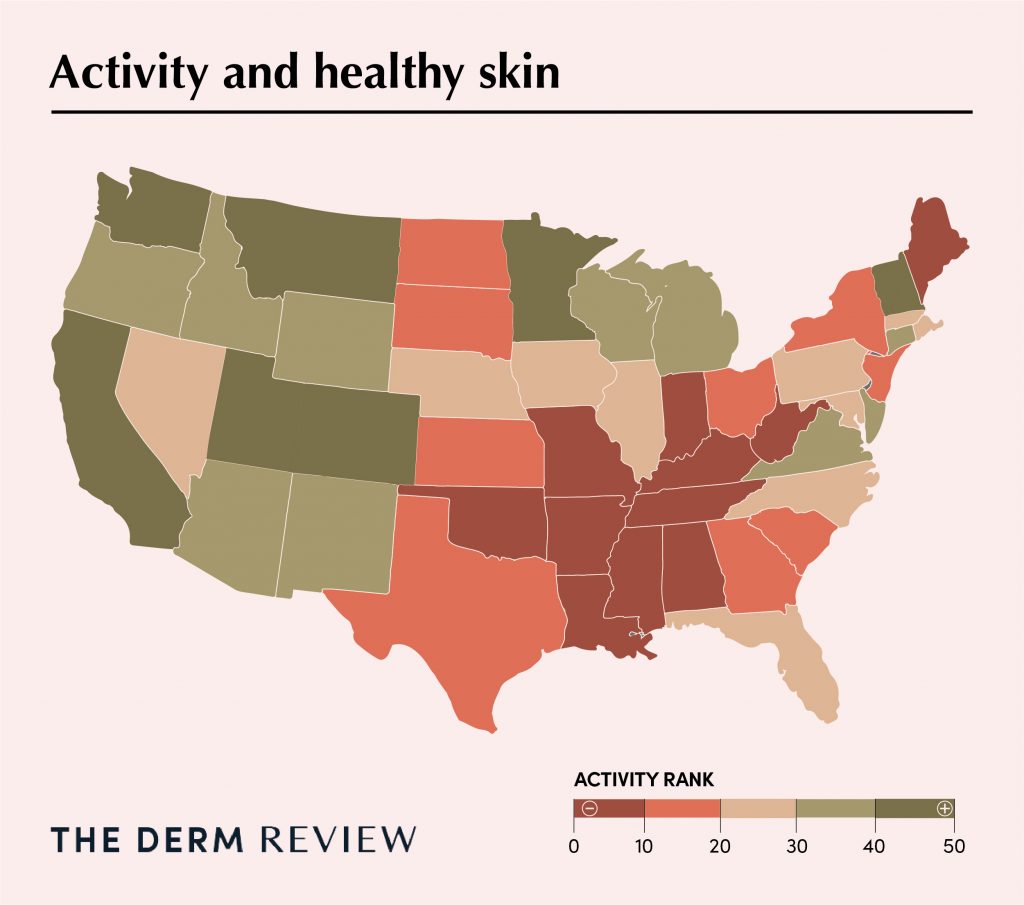
Our analysis found that Utah has the most active population, with just 18.5% reported as engaging in no leisure-time physical activity. The second most active state in the US is Colorado, with just 18.7% not engaging in physical exercise.
Mississippi was found to be the least active state, with 37.7% of the population engaging in no leisure-time physical activity. Oklahoma is the second least active, with over a third (34%) of the state’s population not engaging in, potentially skin health improving, physical exercise.
Obesity and skin health
Obesity can lead to numerous health and skin issues, in part due to the increase in skin surface areas but also due to the impact on the body’s functions and blood flow.
Some of the skin impacts are; changes and imbalances in hormones, increased sweating and sebum production causing breakouts of acne, increased water loss causing dryer skin and dermatitis types of conditions, stretch marks, and even bacterial and fungal infections.
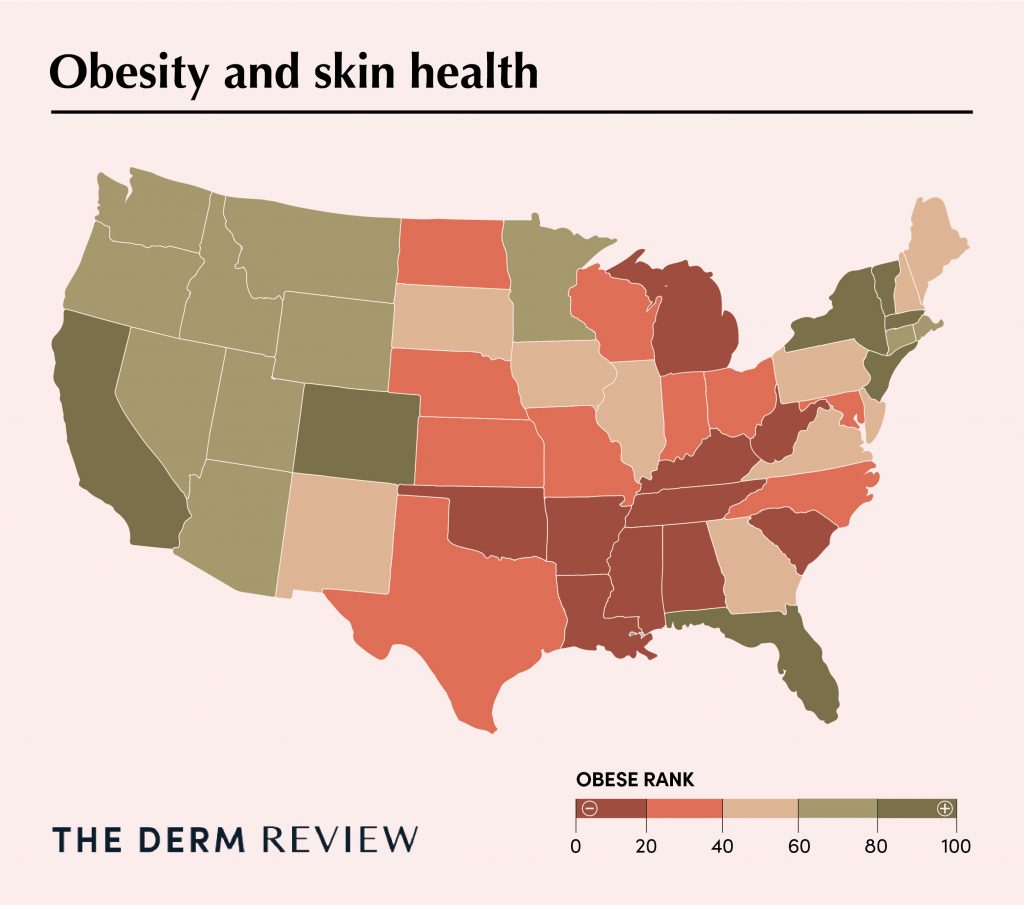
Researching CDC data, we found that Colorado has the lowest population of obese adults (23.8%), with Massachusetts (25.2%) and New Jersey (25.7%) round off the states with the lowest percentages of obese adults.
Mississippi was found to have the largest percentage of obese adults, with 40.8% of the adult population recorded and estimated to be obese by the CDC.
Income and skin health
From access and affordability of products to home infrastructure and facilities, income can play a surprising part in skin health.
Those in more affluent areas often have access to “better” products and services for this skin health, while also being able to afford (and access) better food and physical activity options, which can aid in ‘healthier’ lifestyles.
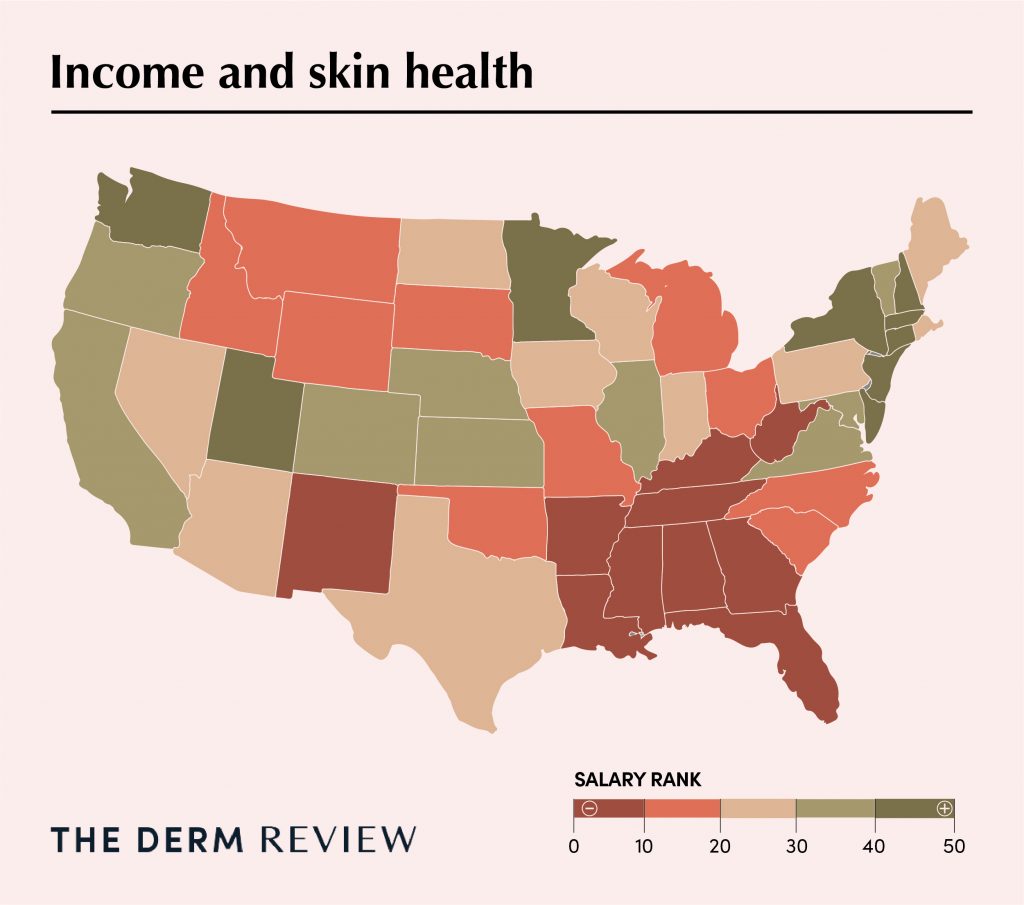
Analyzing annual median household income by state, we found that those living in Maryland have the highest median house income, with a median income of $95,572. Maryland is followed in the rankings by New Jersey, where the median household income is $87,726.
Mississippi ($44,787) and Louisiana ($51,707) were found to have the lowest median household incomes, with the median income in Mississippi less than half that of Maryland.
Best states for skin health index
|
States |
UV Exposure Score |
Water Quality Score |
Air Quality Score |
Average Temperature Score |
Relative Humidity Score |
Sleep Hours Score |
Fruit Consumption Score |
Physical Activity Score |
Obese Population Score |
Median Income Score |
Total Score |
|
New Jersey |
64 |
37 |
21 |
28 |
34 |
96 |
92 |
14 |
92 |
47 |
525 |
|
New York |
90 |
42 |
34 |
13 |
20 |
82 |
88 |
18 |
84 |
31 |
502 |
|
Connecticut |
82 |
36 |
16 |
21 |
28 |
66 |
90 |
38 |
76 |
45 |
498 |
|
Massachusetts |
74 |
41 |
32 |
15 |
14 |
54 |
94 |
26 |
94 |
46 |
490 |
|
Washington |
96 |
28 |
48 |
16 |
12 |
28 |
74 |
46 |
80 |
42 |
470 |
|
Vermont |
92 |
39 |
41 |
6 |
7 |
6 |
96 |
43 |
88 |
36 |
454 |
|
Maryland |
56 |
29 |
8 |
30 |
31 |
94 |
64 |
39 |
50 |
48 |
449 |
|
Oregon |
62 |
35 |
47 |
17 |
33 |
22 |
80 |
36 |
78 |
38 |
448 |
|
New Hampshire |
78 |
25 |
39 |
8 |
22 |
48 |
82 |
42 |
54 |
44 |
442 |
|
Rhode Island |
72 |
44 |
23 |
23 |
12 |
72 |
78 |
23 |
68 |
27 |
442 |
|
Pennsylvania |
86 |
31 |
14 |
19 |
26 |
86 |
62 |
29 |
44 |
28 |
425 |
|
Minnesota |
80 |
18 |
42 |
3 |
22 |
18 |
84 |
44 |
66 |
41 |
418 |
|
Virginia |
44 |
40 |
16 |
33 |
32 |
70 |
54 |
33 |
52 |
40 |
414 |
|
California |
10 |
21 |
13 |
38 |
41 |
40 |
74 |
41 |
90 |
39 |
407 |
|
Delaware |
54 |
30 |
11 |
34 |
16 |
92 |
66 |
22 |
32 |
35 |
392 |
|
Maine |
88 |
48 |
46 |
2 |
7 |
26 |
84 |
10 |
56 |
22 |
389 |
|
Wisconsin |
84 |
24 |
38 |
7 |
9 |
50 |
50 |
40 |
34 |
24 |
360 |
|
Montana |
66 |
20 |
36 |
5 |
42 |
12 |
38 |
45 |
80 |
12 |
356 |
|
Idaho |
46 |
32 |
20 |
9 |
40 |
8 |
70 |
37 |
72 |
20 |
354 |
|
Illinois |
48 |
6 |
25 |
26 |
16 |
46 |
54 |
29 |
60 |
37 |
347 |
|
Michigan |
94 |
9 |
29 |
9 |
5 |
90 |
44 |
31 |
16 |
16 |
343 |
|
Colorado |
12 |
17 |
7 |
11 |
44 |
10 |
66 |
47 |
96 |
32 |
342 |
|
Utah |
16 |
4 |
1 |
18 |
45 |
20 |
72 |
48 |
74 |
43 |
341 |
|
Florida |
14 |
8 |
39 |
48 |
1 |
58 |
54 |
23 |
86 |
10 |
341 |
|
Nevada |
6 |
34 |
30 |
22 |
45 |
64 |
16 |
28 |
64 |
30 |
339 |
|
Arizona |
2 |
7 |
15 |
40 |
47 |
42 |
52 |
35 |
62 |
29 |
331 |
|
North Carolina |
34 |
43 |
10 |
37 |
21 |
36 |
60 |
27 |
38 |
14 |
320 |
|
Texas |
8 |
27 |
33 |
46 |
38 |
38 |
36 |
18 |
38 |
25 |
307 |
|
Georgia |
22 |
45 |
2 |
45 |
14 |
80 |
20 |
17 |
46 |
9 |
300 |
|
Nebraska |
36 |
12 |
44 |
19 |
36 |
16 |
46 |
21 |
36 |
33 |
299 |
|
Wyoming |
38 |
13 |
16 |
4 |
43 |
32 |
28 |
34 |
70 |
19 |
297 |
|
Ohio |
76 |
5 |
2 |
24 |
11 |
88 |
26 |
15 |
26 |
18 |
291 |
|
South Carolina |
26 |
46 |
19 |
42 |
30 |
56 |
18 |
13 |
20 |
15 |
285 |
|
Tennessee |
42 |
47 |
5 |
36 |
27 |
76 |
24 |
10 |
10 |
8 |
285 |
|
Kansas |
20 |
14 |
28 |
31 |
37 |
30 |
34 |
20 |
24 |
34 |
272 |
|
Iowa |
58 |
11 |
43 |
14 |
4 |
14 |
42 |
23 |
42 |
21 |
272 |
|
Missouri |
40 |
15 |
22 |
32 |
28 |
52 |
28 |
9 |
26 |
13 |
265 |
|
South Dakota |
52 |
1 |
36 |
12 |
35 |
2 |
48 |
12 |
48 |
17 |
263 |
|
New Mexico |
4 |
16 |
30 |
29 |
48 |
24 |
20 |
31 |
56 |
3 |
261 |
|
Indiana |
60 |
10 |
5 |
25 |
6 |
60 |
32 |
8 |
22 |
23 |
251 |
|
West Virginia |
70 |
19 |
4 |
26 |
25 |
78 |
10 |
6 |
4 |
4 |
246 |
|
North Dakota |
68 |
2 |
44 |
1 |
16 |
4 |
40 |
16 |
26 |
26 |
243 |
|
Kentucky |
50 |
25 |
12 |
35 |
24 |
62 |
14 |
3 |
10 |
6 |
241 |
|
Alabama |
32 |
38 |
9 |
43 |
9 |
68 |
12 |
5 |
14 |
7 |
237 |
|
Louisiana |
24 |
21 |
34 |
47 |
2 |
74 |
6 |
4 |
18 |
2 |
232 |
|
Arkansas |
30 |
33 |
27 |
41 |
16 |
44 |
8 |
6 |
6 |
5 |
216 |
|
Mississippi |
28 |
23 |
23 |
44 |
3 |
84 |
4 |
1 |
2 |
1 |
213 |
|
Oklahoma |
18 |
3 |
26 |
39 |
39 |
34 |
2 |
2 |
8 |
11 |
182 |
Methodology:
States were analyzed across 11 factors – including UV exposure, water quality, humidity, sleep hours, diet, and obesity rates – to provide an insight into how each state ranks in environmental and lifestyle areas that can impact skin health.
Ranking each state’s performance in each area, we used a weighted scoring to highlight the areas that can impact skin health most (UV exposure, sleep hours, diet, and obesity). A total of 672 points were available in the analysis.
The continental US was used in this analysis due to the reporting of some figures Alaska and Hawaii not being available with methodologies that match continental data.
Sources:
- https://gis.cancer.gov/tools/uv-exposure/
- http://www.usa.com/rank/us–air-quality-index–state-rank.htm
- https://www.currentresults.com/Weather/US/average-annual-state-temperatures.php
- https://www.cdc.gov/brfss/annual_data/annual_2019.html
- https://www.forbes.com/sites/brianbrettschneider/2018/08/23/oh-the-humidity-why-is-alaska-the-most-humid-state/?sh=198970bd330c
- https://fred.stlouisfed.org/release/tables?rid=249&eid=259462

